Making raw data usable for non-data savvy users
At Cigna, every data request required a data analyst — who'd find the data, clean it, build the output. The cycle took days, often came back wrong, and then repeated. Business users had no way to get insights independently.
Build a self-service tool so business users could create their own reports and dashboards — no analyst dependency, no lag time, no lost-in-translation outputs. The challenge: the data is enterprise-scale, deeply technical, and structured for machines, not people.
Over ~10 months, I led the UX across data analysts, stakeholders, and engineering — from concept through proof-of-concept. Two design directions: a conventional cascading UI for structured selection, and a node-edge visualization built for exploration and discovery.
Data is not built for humans — and healthcare data especially so.
Enterprise data is structured for storage and retrieval, not for exploration. At Cigna, that meant data living across multiple data lakes with complex relational structures, hundreds of dimensions and measures, and field names that meant nothing without deep technical context. There was no human-readable layer — no way in for someone who wasn't already fluent in the architecture.
Healthcare data compounds this further. It spans clinical, financial, demographic, pharmacy, and behavioral domains — all interconnected, all with their own structures and vocabularies. Even understanding what data exists, let alone how to find and use it, required expertise most business users simply don't have.
A fundamental discovery problem. The users who most needed data-driven insights — to make decisions, identify trends, understand their members — were the most dependent on others to get it for them. Every request routed through an analyst who would find the right data, clean it, and build the output — a process that took days and often came back not quite right. The cycle would repeat. The goal was to remove that dependency by making the data navigable, discoverable, and usable directly.
Before any design work began, the problem needed to be structured.
With a cross-functional team spanning stakeholders, data analysts, and developers, I framed the goals across three dimensions to align the team and anchor every design decision that followed. When design decisions came up — and they always do — we had clear criteria to evaluate against.
Reduce operational overhead
Reduce the overhead of routing data requests through analysts, and enable data-driven decision making at the business user level — faster, more accurately, and without the back-and-forth.
Make data human-readable
The data lived across multiple fragmented data lakes. Before it could be useful, it needed to be unified into a single accessible source — and critically, made human-readable. Not just technically consolidated, but restructured so that field names, relationships, and hierarchies made sense to someone who didn't write the schema.
Enable independent data use
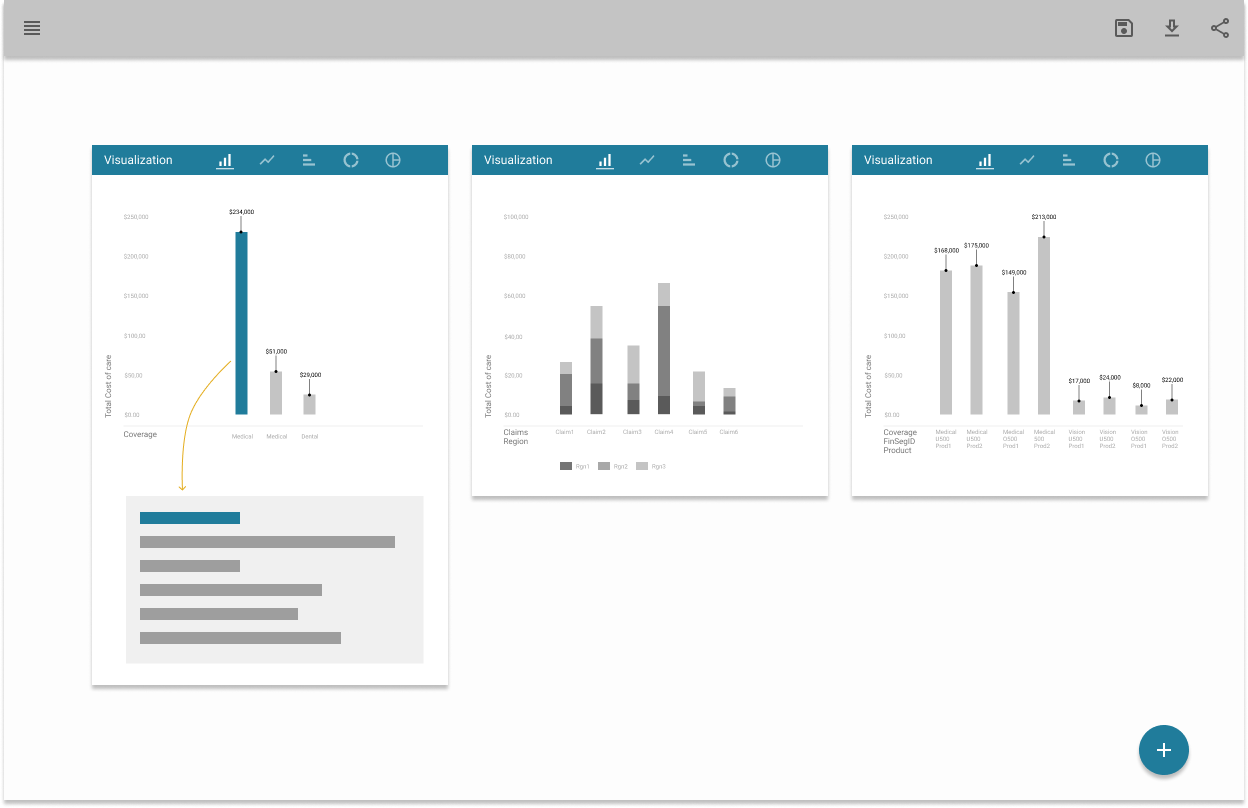
Enable a non-data-savvy user to independently find, discover, and use stored data to do two things: generate reports for clients, and build dashboards that measure client performance — without needing an analyst in the loop.
These three goal dimensions gave the team a shared framework. It also kept the scope honest across a 10-month project — when we hit ambiguity, we could evaluate decisions against all three dimensions simultaneously, not just the one whoever was in the room cared about most.
Before a single wireframe was sketched, I needed to understand what we were designing around.
That meant getting into the data itself — not as a data analyst, but as someone who needed to make it navigable for people who weren't.
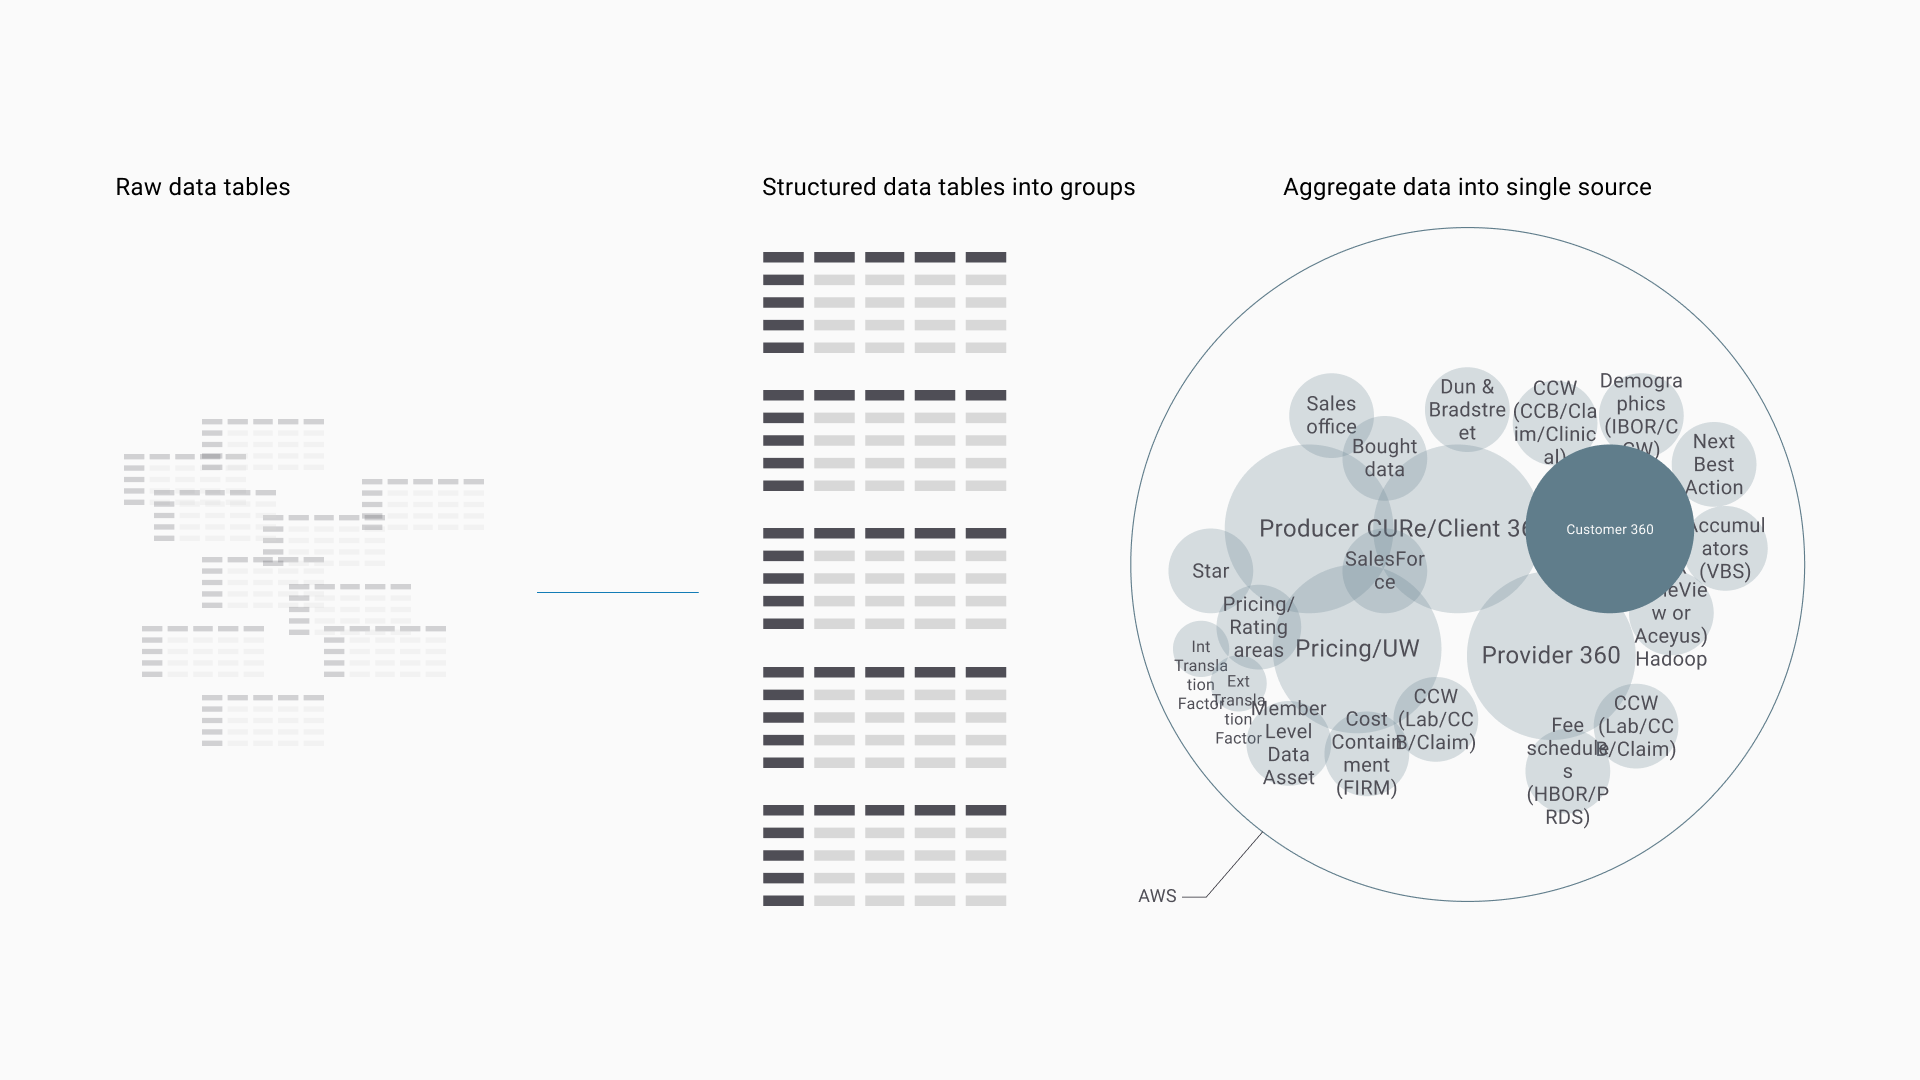
Cigna's data existed across a sprawling set of fragmented sources — clinical, claims, provider, pharmacy, financial, demographic, sales, and third-party data — all living in separate warehouses. These were deeply interconnected datasets with complex relationships that weren't visible or legible to anyone outside the data team.
The broader initiative was moving toward a unified data lake, but consolidation alone wasn't the answer to the design problem. The data was structured for machines, not people — and renaming thousands of fields to be human-readable wasn't a viable path. Instead, we identified a single high-relevancy database to use as a test case. Working from that, we developed schemas and organized fields into logical groupings using human-readable language — improving findability and discoverability without touching the underlying data architecture.
Using a narrow but highly relevant database as our POC gave us a realistic and manageable scope. We could develop the data schemas, structures, and relationships needed to let users successfully complete their tasks — then validate the model before scaling. This constraint was a feature, not a limitation. It let us focus the design effort on a real, testable system rather than designing against a hypothetical one.
This was the core design problem — and where the most foundational work happened.
How data is stored is not how users think about data. Database architecture is built for retrieval efficiency. Information architecture is built for human comprehension. These are fundamentally different structures, and bridging them was the key design challenge. You can't hand a user a data schema and call it a UI.
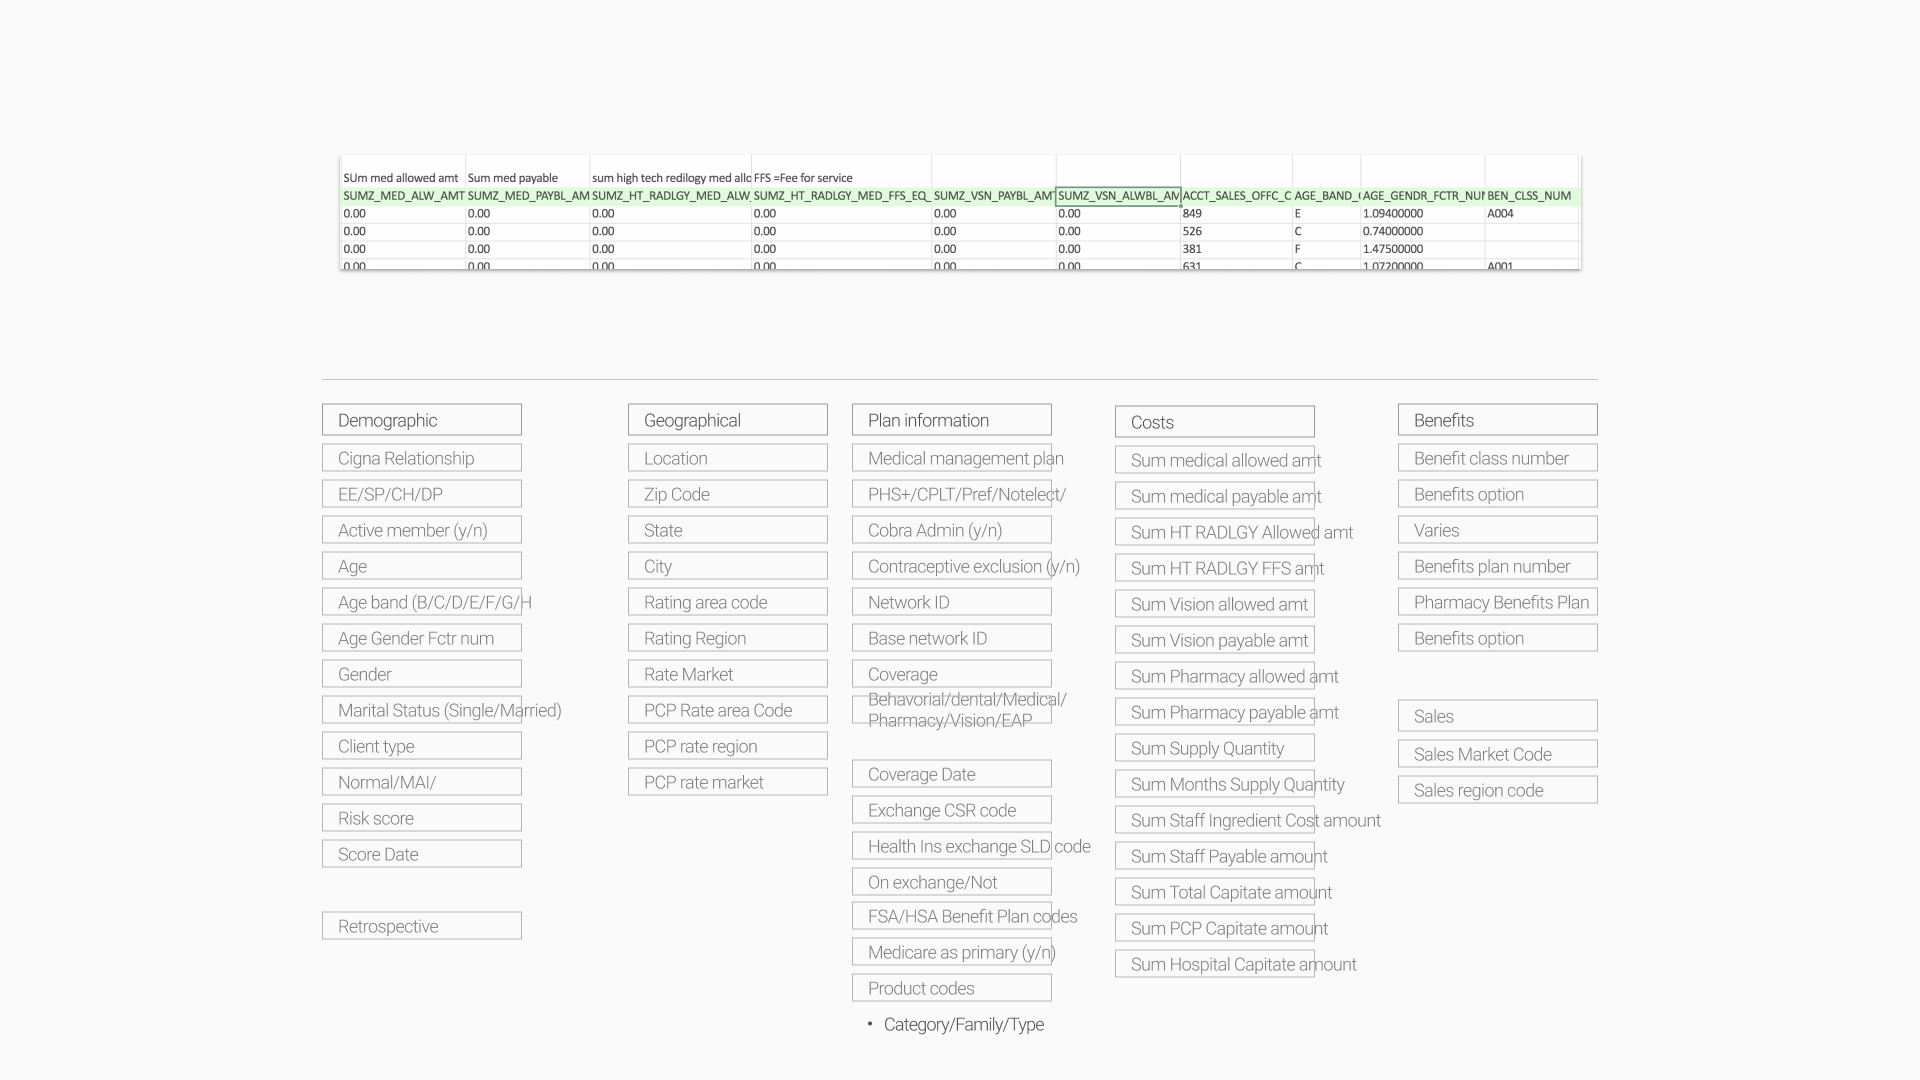
Rather than restructuring the underlying data, we built an IA on top of it. Using our test database as the foundation, we organized hundreds of raw fields into logical, human-readable categories and hierarchies — grouping related fields into families that matched how a business user would naturally think about their data. Demographic information, plan details, coverage, costs, geographic data — structured not by how the database stored them, but by how a user would go looking for them.
The target IA followed a hub and spoke structure — a central node with clearly defined categories branching outward, each containing progressively more specific fields and values. This gave users a mental model they could navigate without needing to understand the underlying data relationships. They could start broad and drill down, rather than needing to know exactly what they were looking for before they started.
A key decision was designing for exploration as much as retrieval. Users often don't know the exact name of a field — they know what they want to understand, not how the data labels it. The IA needed to support fuzzy, intuitive searching so users could find data using natural language and context, not technical field names.
| # | Term | Definition | Example |
|---|---|---|---|
| 02.1 | Dashboard | At-a-glance views of key performance indicators relevant to a particular objective or business process. | — |
| 02.2 | Database | A common source where specific dimensions and measurables can be found. | cust_prof_sv |
| 02.3 | Dimension | The specific name of a data field within a database. | Gender |
| 02.4 | Measurable | Dimensions that are numbers and can be used in mathematical calculations. | µ age |
| 02.5 | Filter | The ability to select a specified range of a particular Dimension or Measurable. | — |
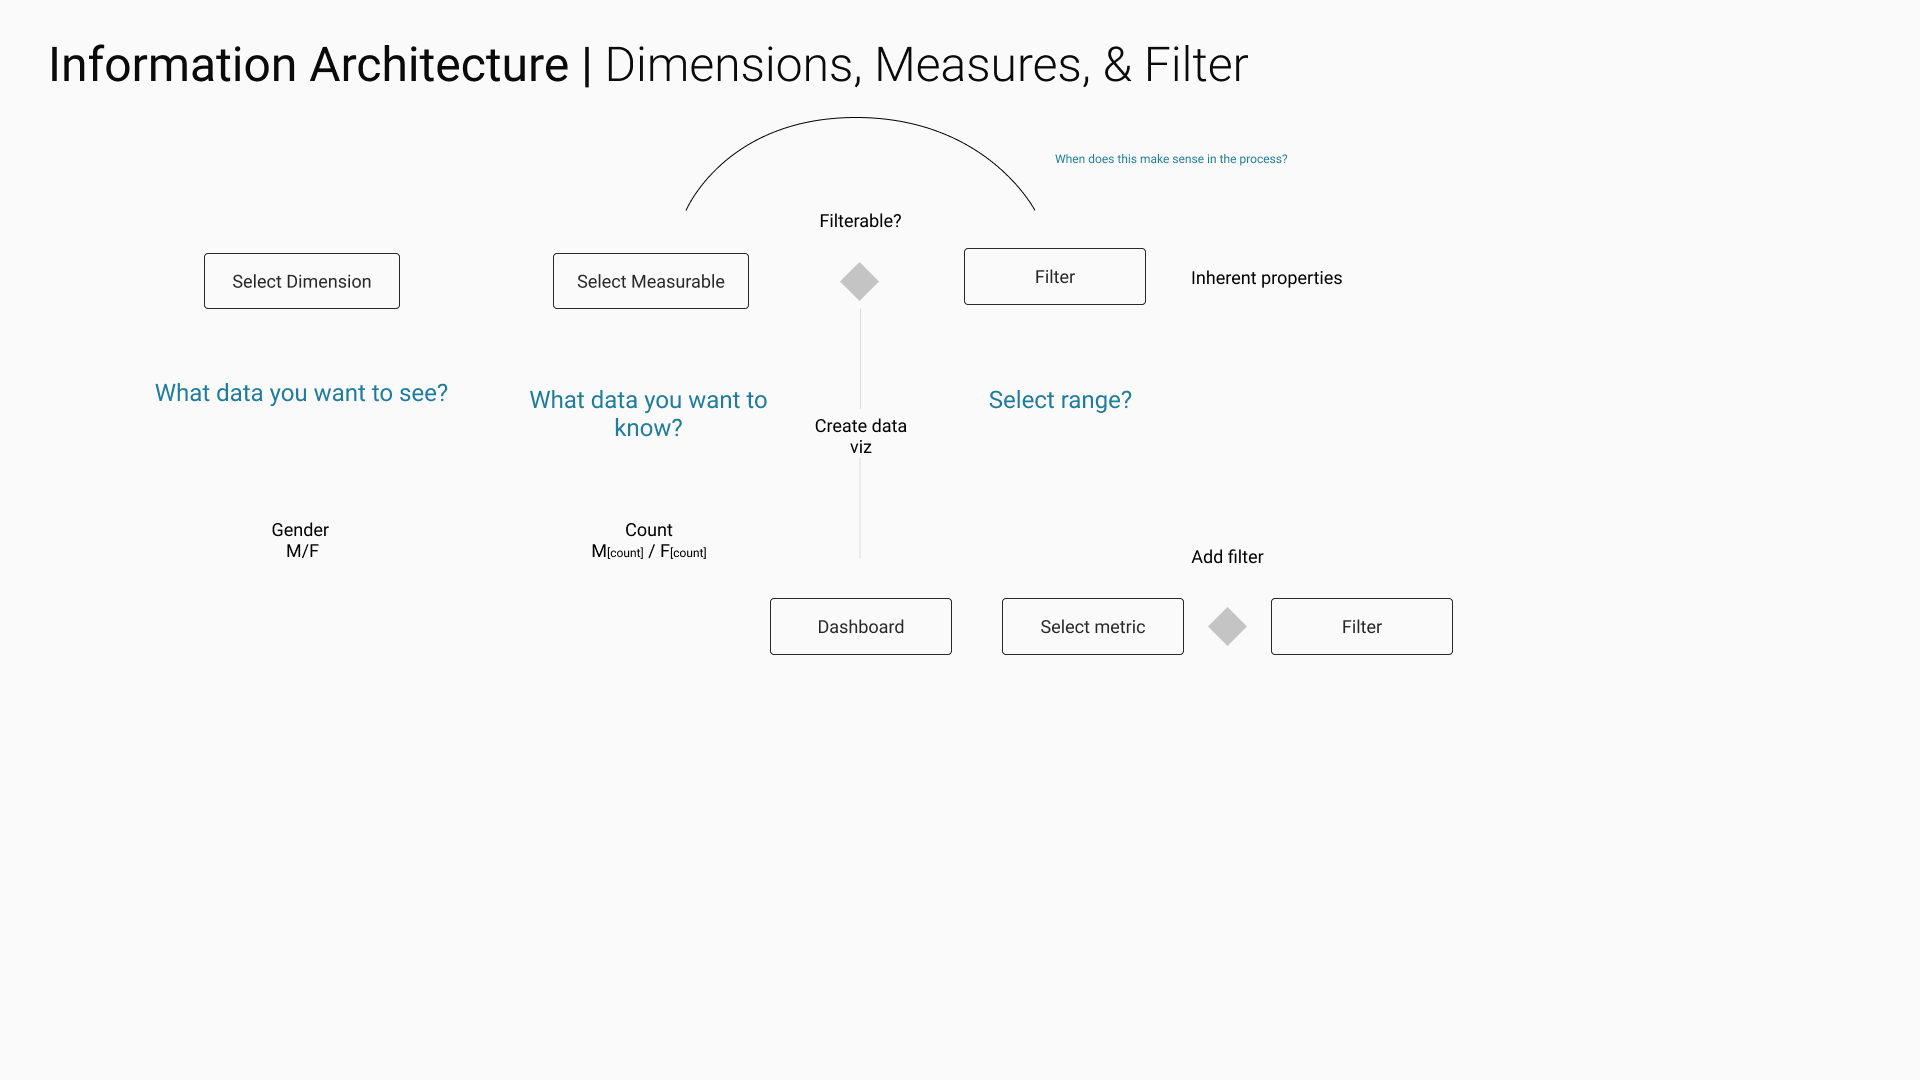
The first path: a structured, familiar UI with sequential data selection.
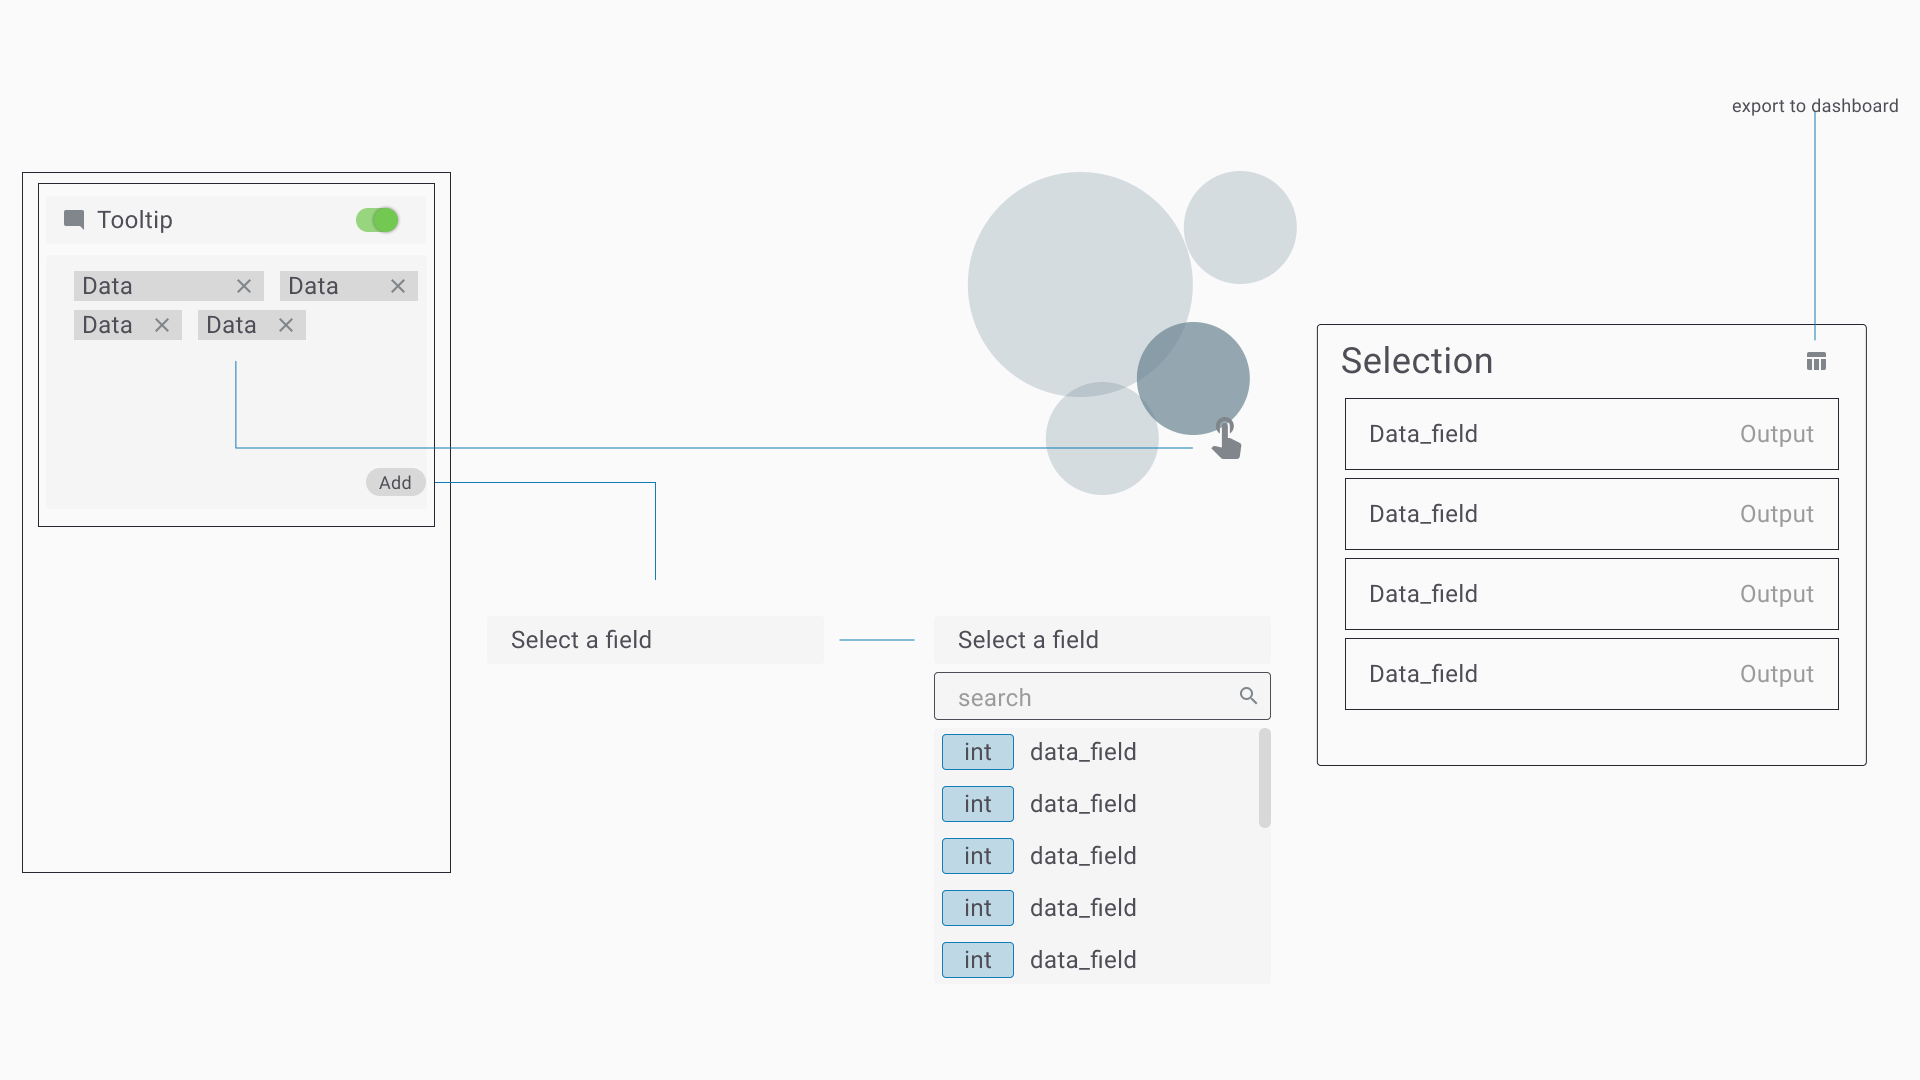
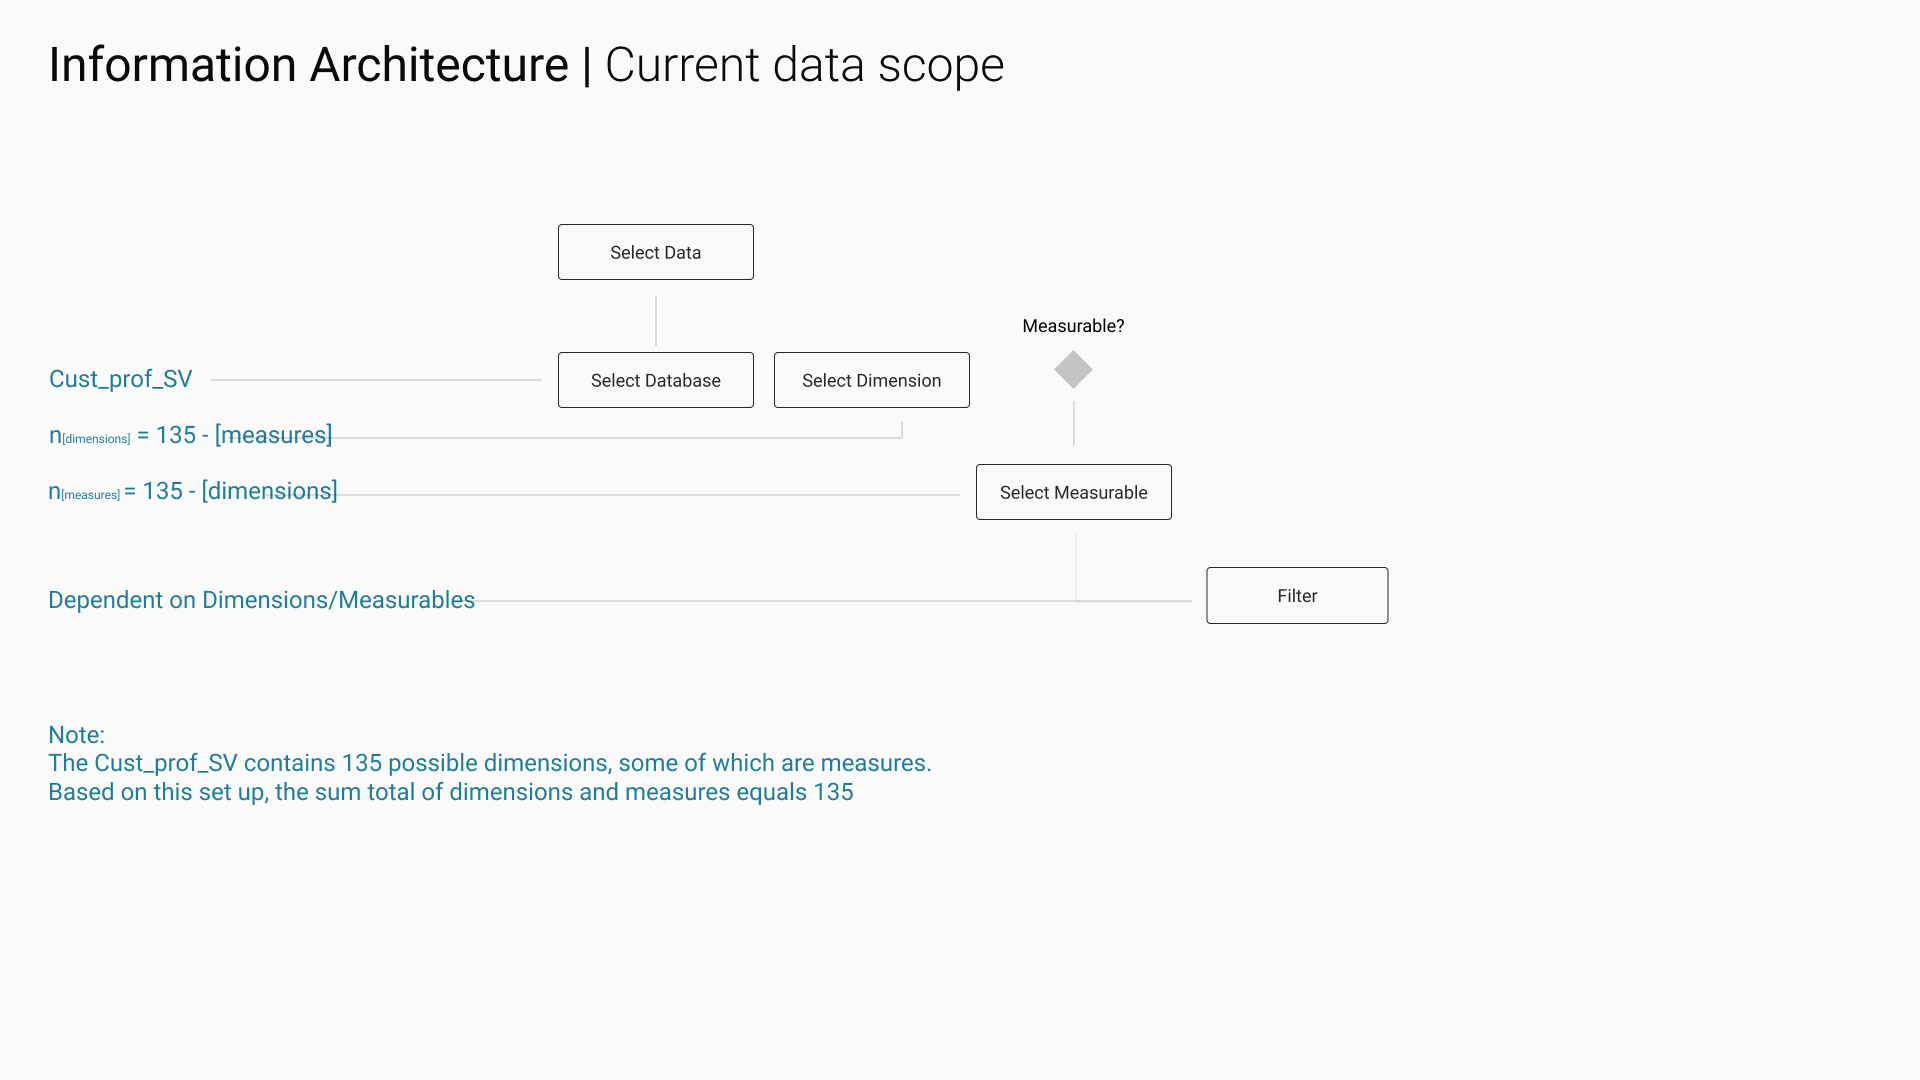
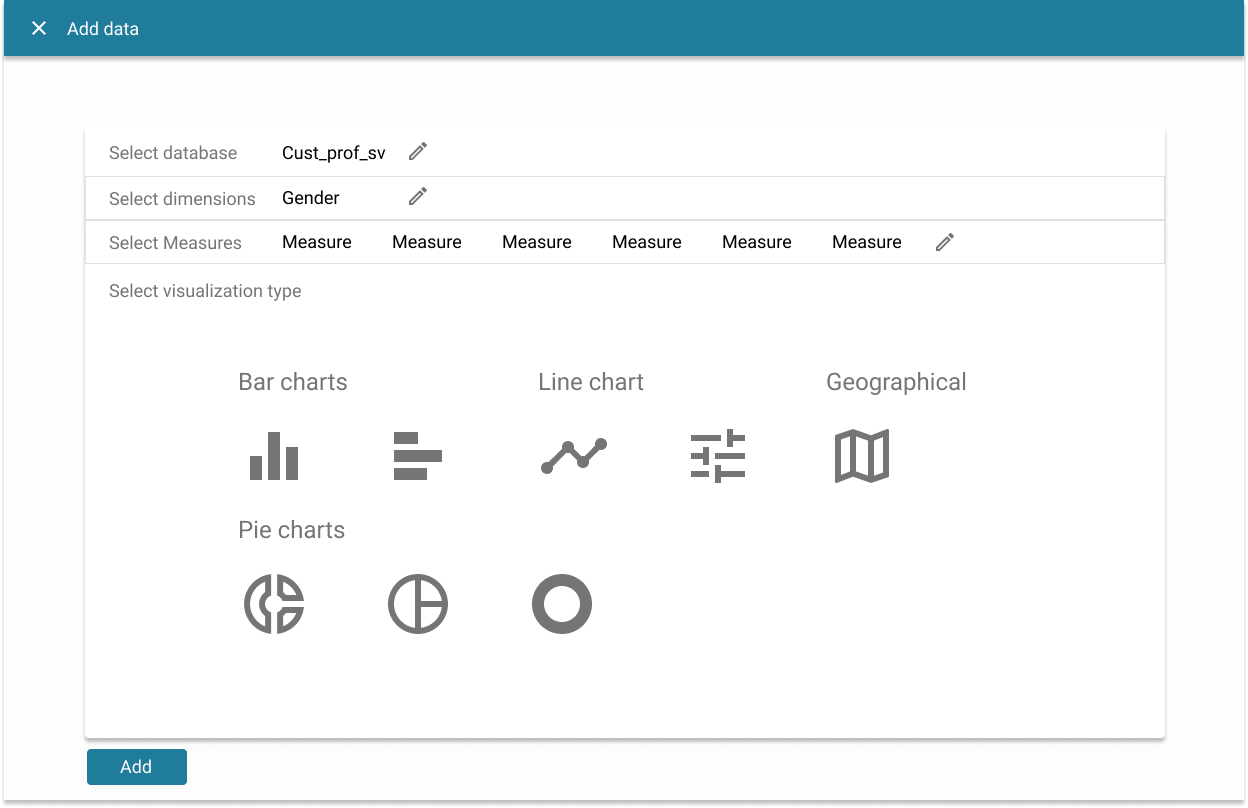
With the IA established, the project split into two parallel design paths. The conventional approach used familiar UI patterns — sequential dropdowns, structured field lists — and a core question: how does a non-technical user navigate hundreds of dimensions and measures to select the data they actually want? Get this wrong and everything downstream breaks.
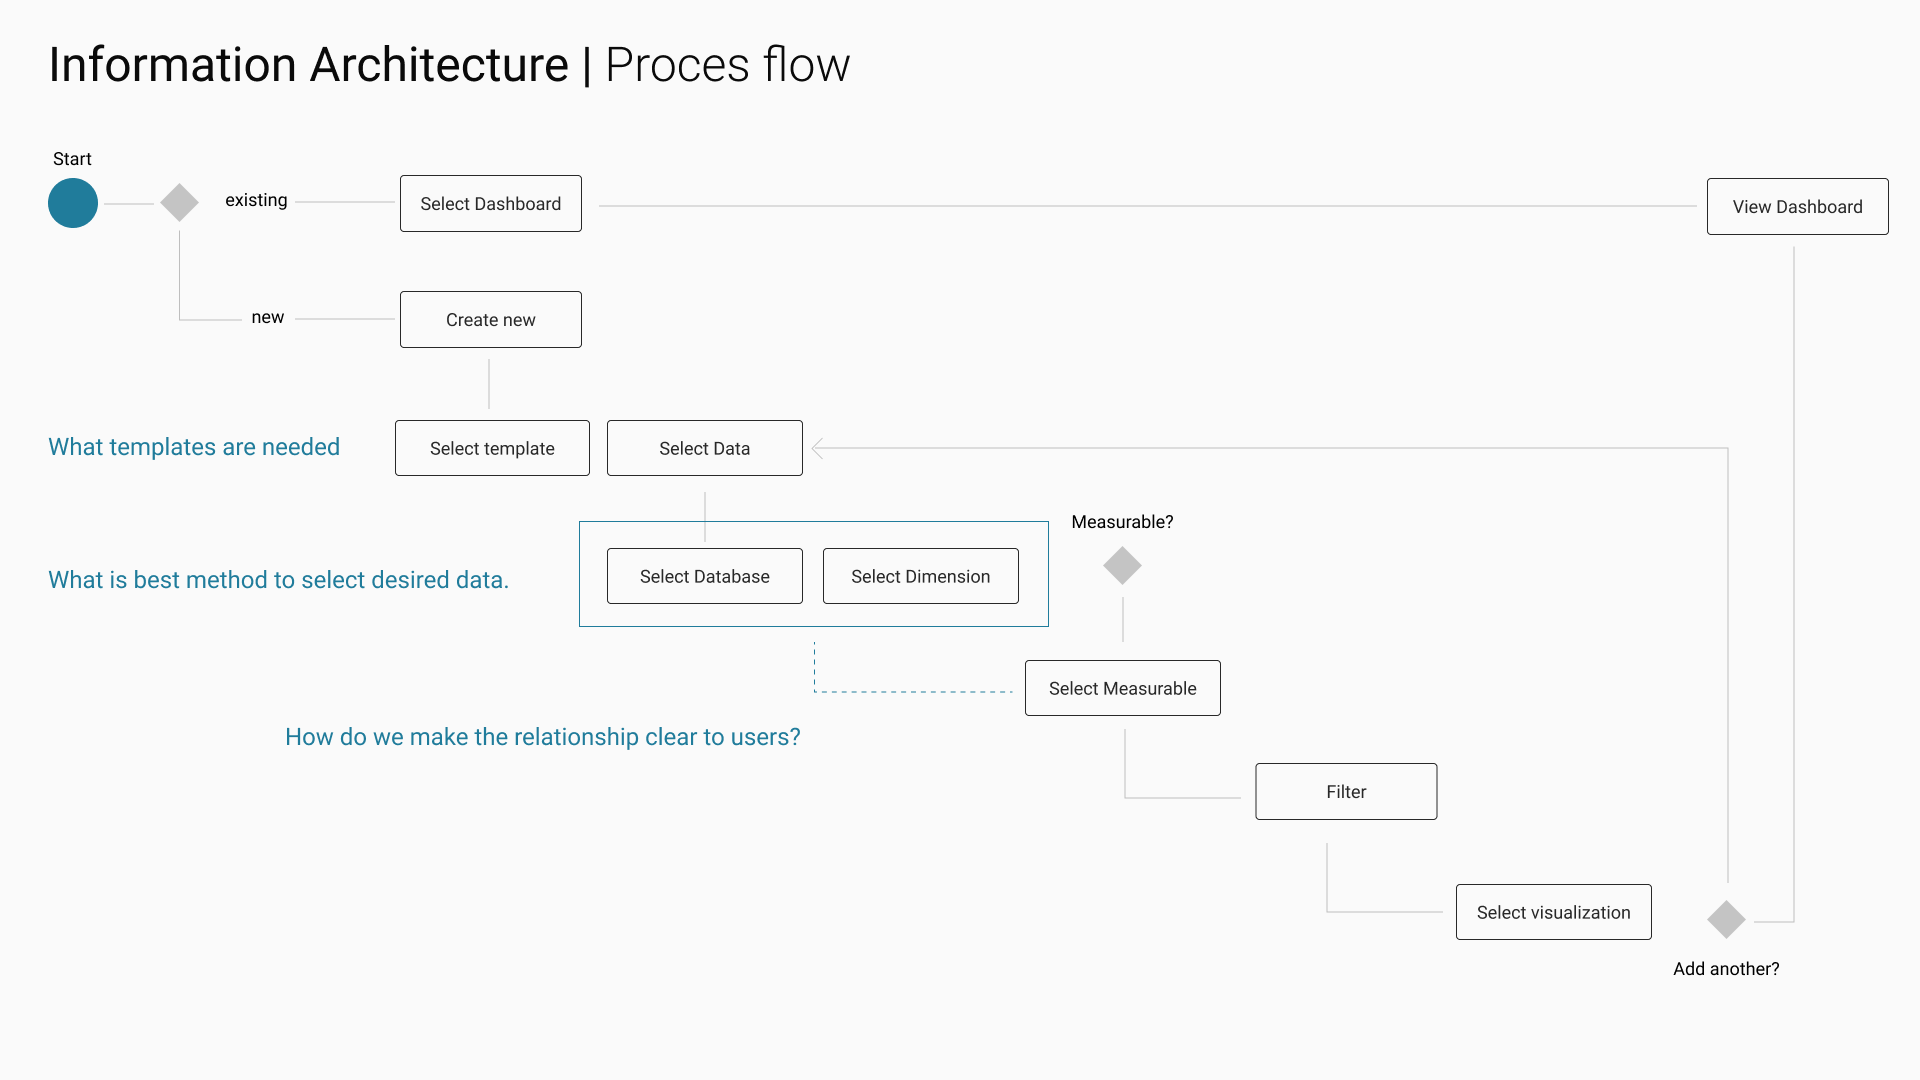
The core tension: how do you make data findable for someone who doesn't know the schema — while still preserving the structure and relationships that make a resulting visualization meaningful?
Two options were evaluated. Both respect the underlying data model (database → dimension → measure). They differ in how much of that structure they expose to the user — and when.
Pros
- Data hierarchy is implicit in the step order
- Familiar pattern · low onboarding cost
- Compact in collapsed state
Cons
- Options hidden until each gate opens
- No way to scan or browse before committing
- Users who don't know field names are stuck
Pros
- All options visible · scannable without prior knowledge
- Dim / Measure labels teach structure through use
- Selection state persistent and reversible
Cons
- Requires more vertical space on first paint
- Field type taxonomy must be precise and consistent
The chip approach offered visibility — users could see and manage their selections clearly. But with the scale of data involved, the open-ended nature of selection risked users building combinations that produced meaningless or invalid visualizations.
The cascading approach introduced sequential gates — select a database, then a dimension, then a measure, in order. That restriction was the point. The hierarchy kept users oriented within the data structure, and each gate prevented invalid combinations before they happened. For a non-technical user who doesn't know what a bad data selection looks like, those guardrails were essential. The constraints it introduced weren't limitations — they were scaffolding.
The second path: make the data itself explorable — visually, spatially, without schema knowledge.
Rather than guiding users through a linear selection sequence, the node-edge UI was designed to make the data's structure navigable — letting users explore relationships visually and discover data through interaction rather than sequential choices.
This direction was sparked by my discovery of Linkurious and their Ogma graph visualization library. Recognizing its potential to solve our core discovery problem, I introduced it to the team as the foundation for building our own custom node-edge interface.
This was a significant decision — healthcare and insurance are traditionally conservative industries with a strong preference for proven, familiar tooling. Making the case for a novel approach required demonstrating not just its design merit but its direct relevance to the business goal. Getting that stakeholder buy-in was itself a meaningful part of the leadership work on this project.
A user selects a database, which surfaces a set of nodes and edges built from the schemas developed during the IA phase. Each node represents a data category, each edge a relationship. Users click through to drill down — moving from broad categories into increasingly specific dimensions and measures, following the structure of the data in a way that felt intuitive rather than technical.
The key distinction from the conventional UI was intent. Where cascading dropdowns guided users to a known destination, the node-edge model supported users who didn't yet know what they were looking for — enabling genuine exploration of the data landscape.
A significant area of experimentation was using the visual properties of the graph itself to encode meaning. Unlike conventional charts, node-edge gave us the ability to represent data through size, position, weight, and other visual properties — directly within the exploration interface.
For example, the edge connecting a demographic node to a cost node could scale in size proportionally to what that demographic represented as a percentage of total costs. This meant users weren't just navigating to data — they were already beginning to read it. The visualization became part of the discovery experience, not just the output at the end of it.
A node-edge visualization can become its own discovery problem if not carefully controlled. A graph with hundreds of visible nodes is visually overwhelming and functionally useless. The design work here was about scoping — surfacing the right amount of data at each level of interaction, using the IA hierarchy to control what was visible and when. A metadata panel surfaced additional context at each level. Fuzzy search allowed users to find dimensions using natural language rather than exact field names.
Recognizing that not all users would be comfortable navigating a graph interface, we built in a fallback that more closely aligned with the conventional UI — giving users a familiar entry point while still benefiting from the underlying node-edge data structure and relationships. Both paths could serve the same user at different moments.
This wasn't a wireframe exercise — we built a working POC of the node-edge interface. Scoped to the same narrow, high-relevancy database used throughout the IA work, it was functional enough to put in front of stakeholders and business users for real testing. That hands-on session is the source of the feedback in the Outcomes section — both the positive reception and the performance limitations that surfaced at scale.
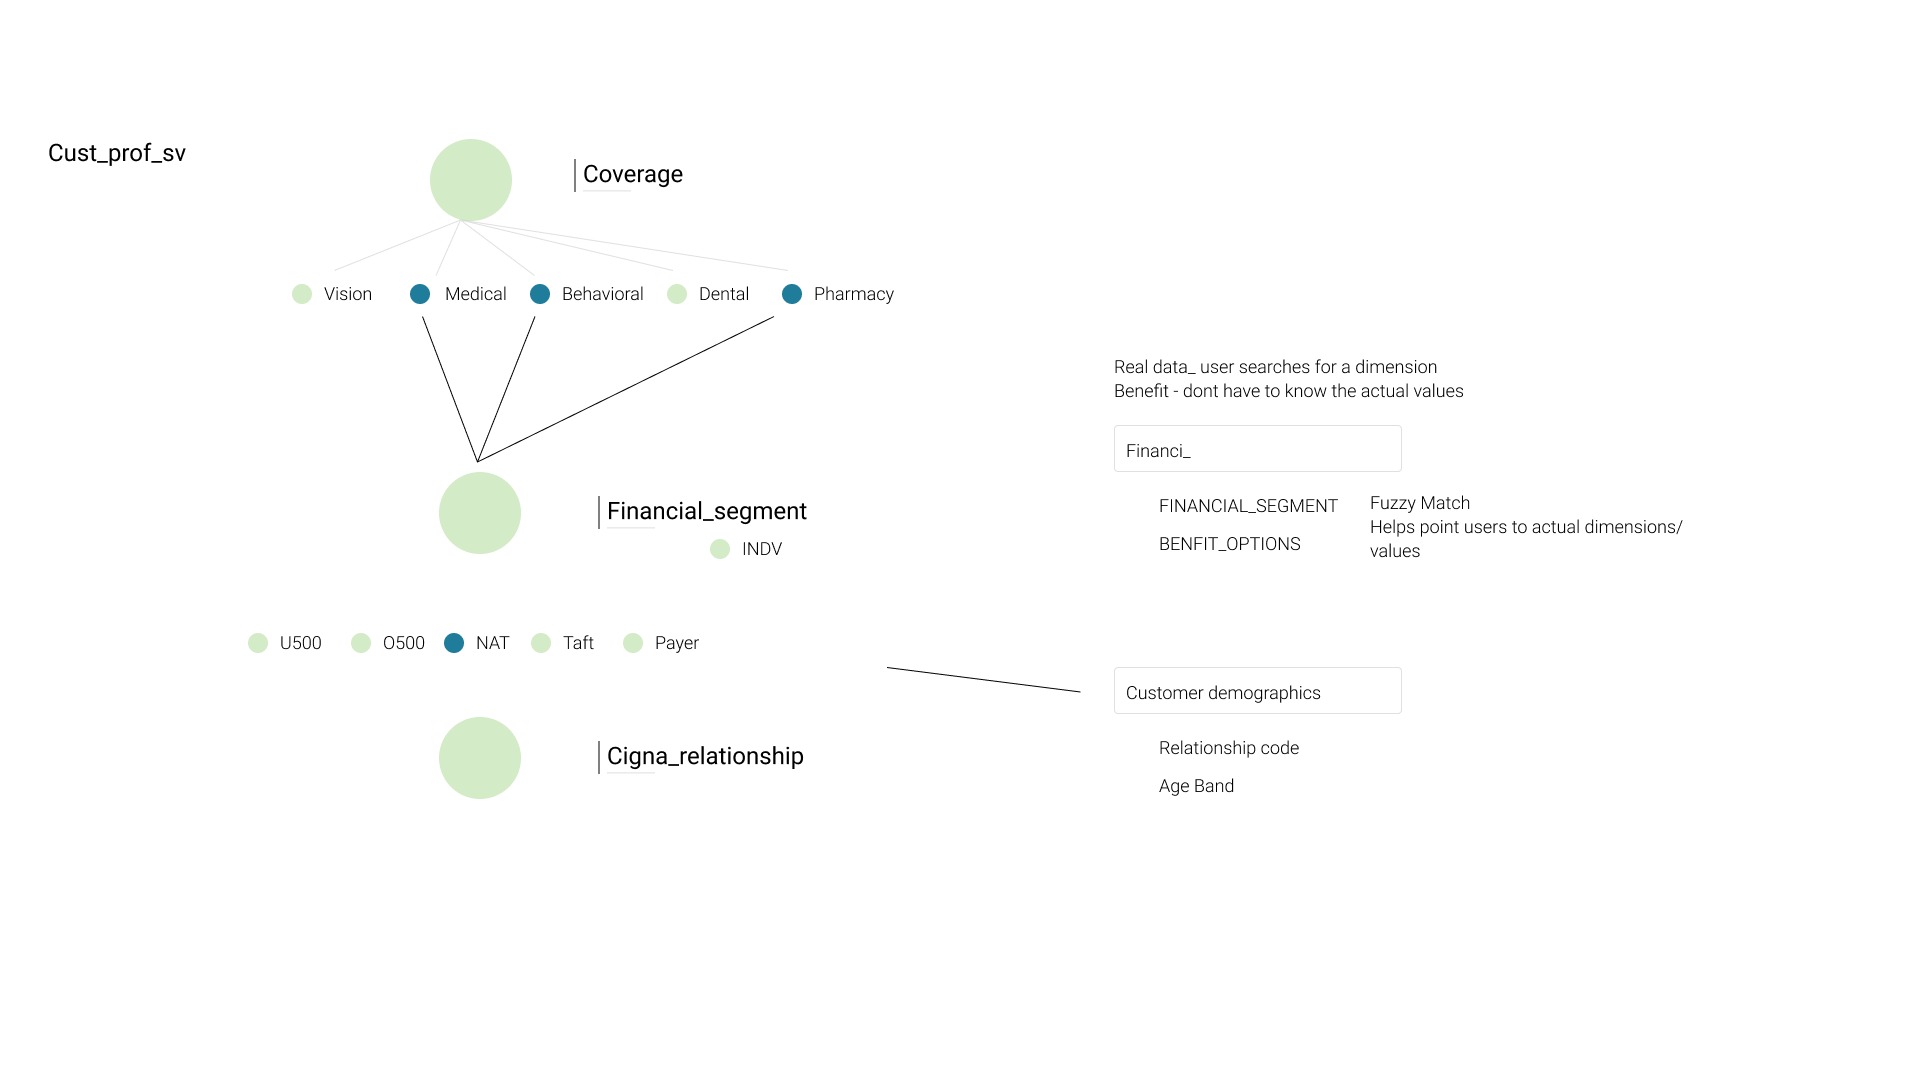
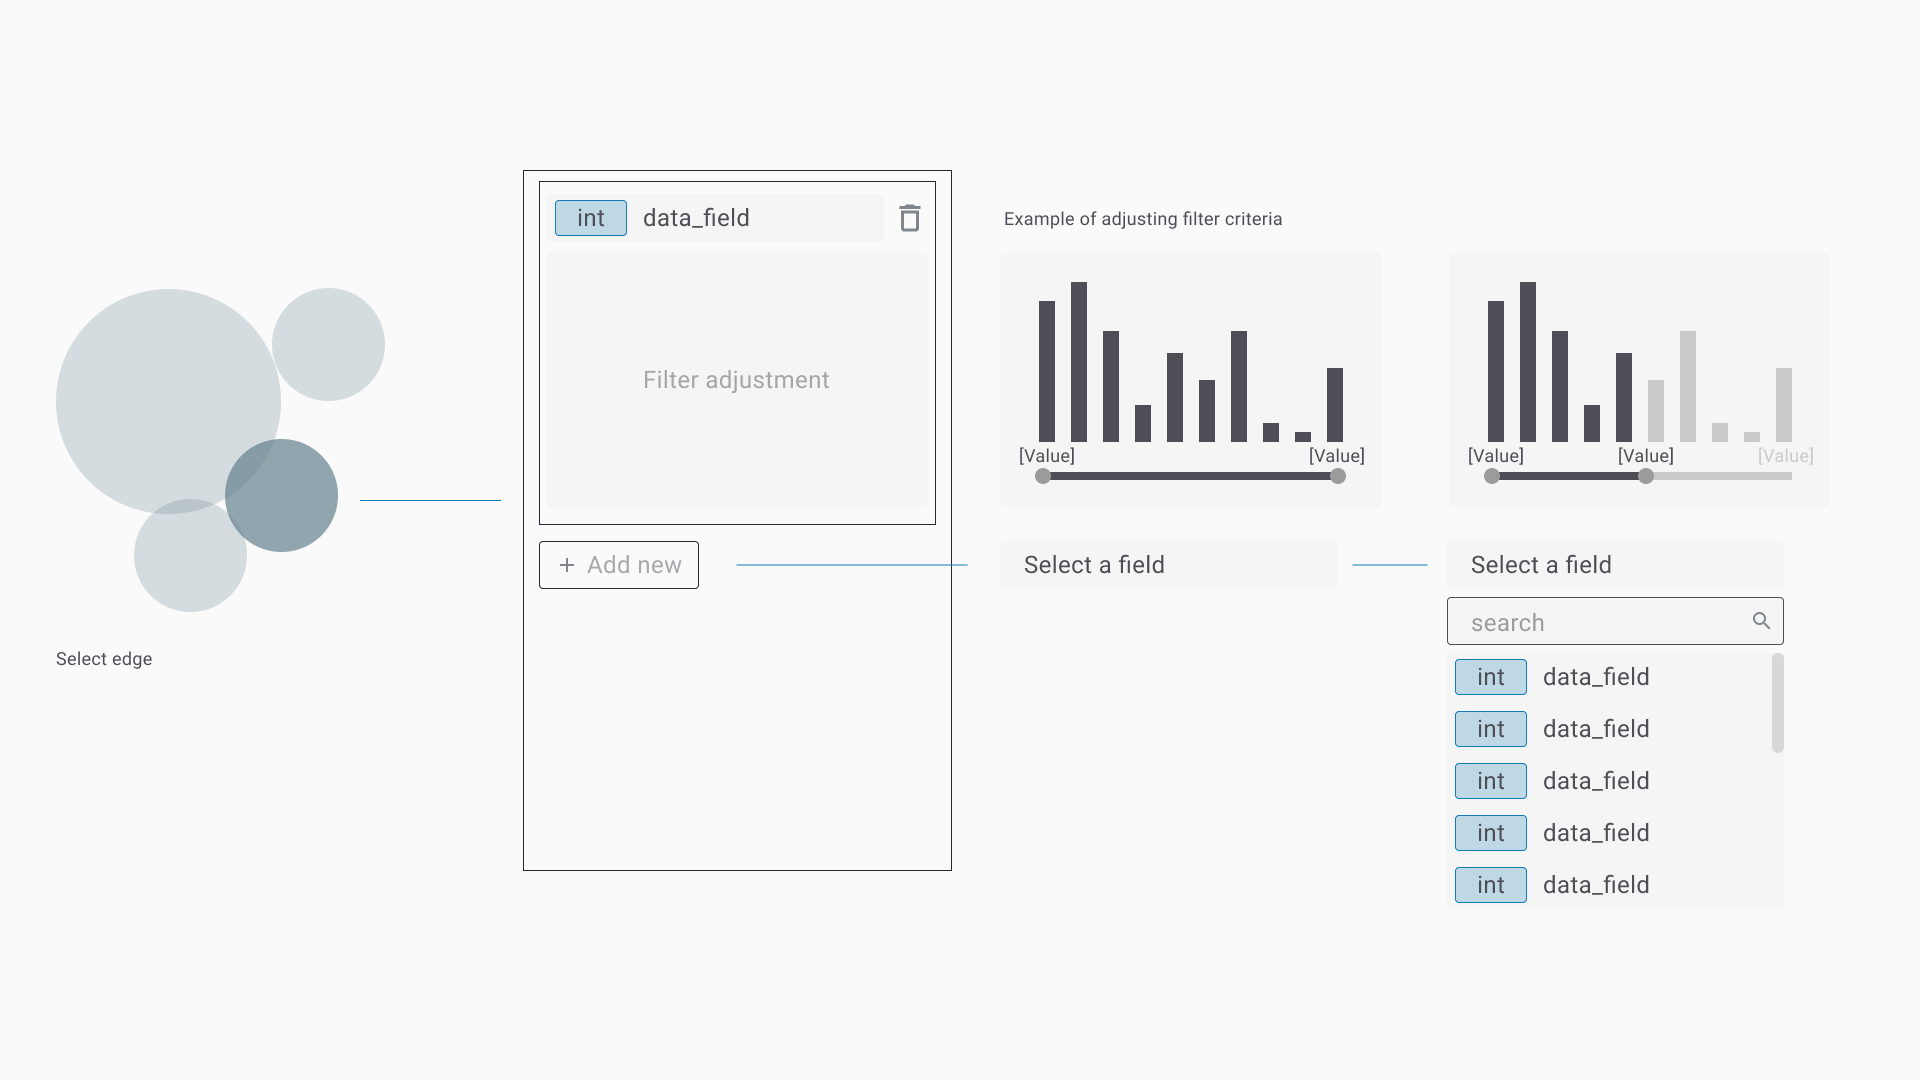
The node-edge path made something visible that the conventional UI couldn't — the relationships between data points. For a non-technical user trying to understand not just what the data shows but how different dimensions connect and influence each other, that was a meaningful shift in how data could be experienced. It also unlocked a design insight we wouldn't have found otherwise: the visualization could do double duty as both navigation and output.
This was a proof-of-concept. The goal was never to ship a finished product — but to validate an approach, establish a direction, and create a foundation to build from.
What was validated
Two viable design paths were established and documented — the conventional cascading UI and the node-edge exploration interface — each with clear rationale, defined interaction patterns, and a shared IA foundation. The work demonstrated that complex healthcare data could be made navigable for non-technical users without restructuring the underlying data architecture.
User reception
Both approaches were well received by business users. The node-edge interface gave users the ability to explore and discover data freely, building confidence through visual navigation. The conventional UI offered control and precision but required users to be more deliberate in their intent. Both were infinitely better than the existing model, where business users had no direct access to the data at all and could only submit requests to analysts and wait.
The technical reality
Scaling the node-edge approach against the full size of Cigna's data lakes introduced performance challenges that couldn't be easily mitigated. We explored multiple approaches to address this, but the cost-benefit analysis was clear — at enterprise scale, the conventional cascading UI was the more viable path forward. A grounded decision, made with full awareness of the trade-offs.
Shared IA vocabulary
Locked down five primitives — dashboard, database, dimension, measurable, filter — giving the cross-functional team a common language and preventing terminology drift across engineering, design, and stakeholders. A small artifact with significant downstream impact on alignment and decision speed.
The decision to move toward the conventional UI wasn't a retreat — it was the result of a rigorous process that explored a genuinely novel approach, validated it with users, stress-tested it against real technical constraints, and made a recommendation grounded in evidence. That process — from ambiguous problem to structured POC to informed direction — is the work.